Data Science Dictionary: P-Values
If you have ever taken any statistics or science classes, you’ve probably heard the term “p-value”. Technically the p means probability: a p-value is the probability of something happening, but I want to tell you that p can stand for a lot of things like Probability, Perplexing, and Part.
Probability
Let’s start with the technical stuff. When we do a hypothesis test, the first thing we do is assume that the null hypothesis is true. Then we collect some data. I’m interested in whether there is a difference between the air speed velocity of African vs. European swallows. I grab my bird catching kit and get a bunch of birds, measure their air speed velocity, and find that on average African swallows are 5mph faster than their European counterparts.

Then I ask “if there were no difference between African and European swallows and I just grab some birds at random, what percent of the time am I going to get groups of African and European Swallows with an average speed difference greater than 5mph?”. The probability of that happening is my p-value: the probability of getting a value as extreme or more extreme than my data—assuming that the null hypothesis is true.


But how do we know how likely all these things are? For each test statistic we have a distribution. To name a few, we have a z-distribution, t-distribution, F-distribution and Chi squared-distribution. All of them have different shapes—some even change depending on how big our sample size is—but they all tell us the relative probability of getting all the different values for each test statistic.

So we calculate a test statistic—say a t-value—based on our data and then mentally draw a line at that value. Our p-value is the proportion of the distribution that is more extreme than that line.

It’s like a pie chart—or better yet a pie. Your p-value is the proportion of the null hypothesis pie you get in your slice. As your slice of pie gets smaller and smaller, you get more and more upset until it is so small that finally you say “screw this pie, I’ll go get some alternative hypothesis pie!”.

Perplexing
Maybe it seems simple but there has been a lot of controversy over the p-value lately. The problem stems from a wide-spread misunderstanding of the p-value. Here is a short list of things a p-value is not:
- the probability that the null hypothesis is true
- the probability that your results are false if you get a significant p-value
- the probability that there actually is an effect if you get an insignificant p-value
- an indication of how practically significant your results are
So why are p-values so perplexing? One reason is that they are not very intuitive. We want statistics to tell us the chance that our hypothesis is correct—or conversely the chance that the null hypothesis is incorrect—but that’s not what frequentist hypothesis tests tell you. In probability notation this is
However, frequentist tests tell us the probability of getting our data, given that the null hypothesis is true:
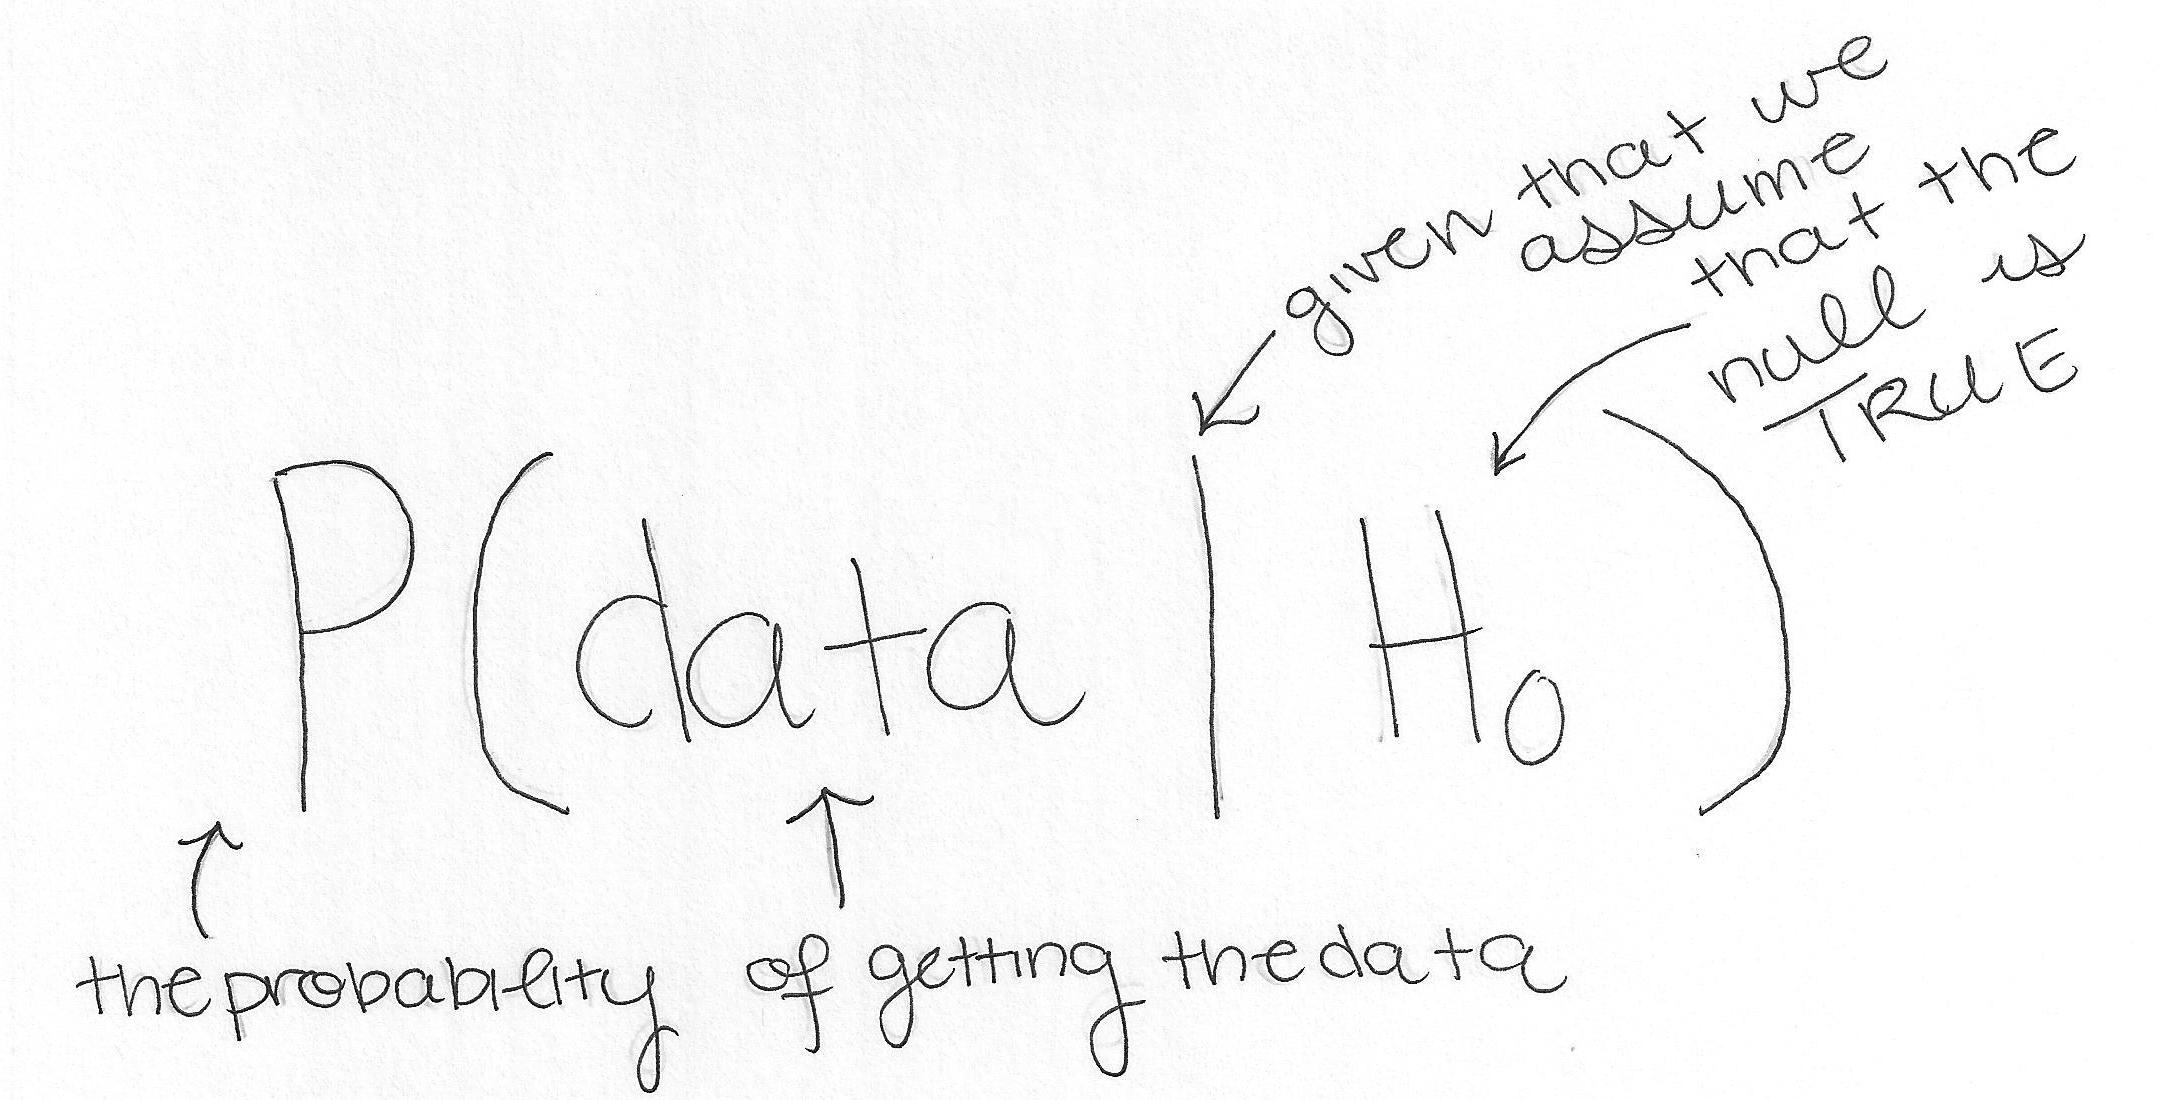
You can see that these two are not the same thing, but we treat P(data|H0) as a proxy for P(H0|data), which contributes both to the confusion and to misstatements about what a significant p-value means. If p-values aren’t taught clearly, this distinction get’s confusing, but it’s more clear in examples like the difference between the probability of being a child given that you’re at Chuck-E-Cheese, and the probability that you’re at Chuck-E-Cheese given that you’re a child.
Part
So what do we do? Do we go the way of some academic journals and scrap p-values? I argue no. The final p is part. P-values are only part of the picture that we need in order to understand our data and what they say about the world around us; they tell us how likely it is that something just happened by chance.
Another important part is effect size. Effect sizes measure how big your effect is relative to how much things vary in the population. If I found that blondes are heavier on average by 3 pounds, that would be more attention grabbing if I were talking about newborns than all adults, because newborns vary less in weight than adults. Effect sizes take your effect (in our case 3 pounds) and divide it by how variable your population is (a lot for adults, a little for newborns).
Together, p-values and effect sizes can give you a better picture of your data and the world around you. They tell you more about practical significance. Saying that you found a 3 pound statistically significant difference in weight doesn’t mean much until you know whether that’s for babies (who vary very little) or adults (who vary a lot).
So before you use or talk about p-values, just remember that they’re the probability of getting your data if the null hypothesis is true, a sometimes perplexing thing to talk about, and only part of the big picture.
If you have any suggestions for topics you’d like to see in the Data Science Dictionary, feel free to reach out! The preferred form of request is “What the heck is ______?”

Author
Chelsea Parlett
Chelsea is the manager of a Cog/Neuro/Psych lab and is obsessed with all things statistical. When she's not collecting or analyzing data, Chelsea loves to hike, read, and tutor. Her dream is to show everyone that statistics are fun! @ChelseaParlett